
Interpreting Indicators
Scoring of indicators is necessary to interpret how each measure relates to the soil function of interest and to allow indicators to be integrated by eliminating unit differences. A common scoring method is the use of non-linear scoring functions. Scoring functions are used widely under various guises in economics as utility functions (Norgaard, 1994), multi-objective decision making as decision functions (Yakowitz et al., 1993), and systems engineering as a tool for modeling (Wymore, 1993). Karlen and Stott (1994) first applied this concept to soil indicator interpretation. They used three main scoring curves: more is better, less-is-better, and mid-point optimum. The Soil Management Assessment Framework (SMAF) uses this same technique but allows for increased variation in curve shape.
In all cases, the optimal score would be given when an indicator value represented high function in the particular soil, i.e., if the indicator was non-limiting to related soil functions and processes such as filtering and buffering, nutrient cycling, or structural stability. Some indicators are crop specific. For instance, the optimum score for soil pH depends on what crop is being grown. Most indicators are site-specific, including interpretation based on inherent soil properties.
For instance, some soils have differences in inherent properties that are readily apparent, such as the inherent organic matter level differences between the soils found in the Southeastern U.S. and the Midwest.
Georgia Ultisol:

Iowa Mollisol:

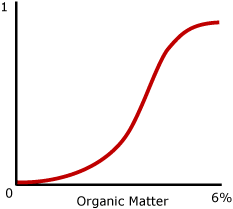
This leads to scoring differences. In the Southeastern soil, 2% total organic carbon (TOC) would receive the highest score. For the Midwestern soil type, 2% TOC would represent a highly degraded soil and would be scored accordingly.
Many different factors influence indicator interpretation or scoring. The table below shows the site-specific factors that influence indicator interpretation (for selected indicators) performed by SMAF.
| Indicator | Factors |
|||
|---|---|---|---|---|
| Primary | Secondary | Tertiary | Quaternary | |
| Available water (AW) | region | texture | inherent OM | |
| Bulk density (BD) | texture | mineralogy | ||
| Electrical conductivity (EC) | method | crop | texture | |
| Microbial biomass C (MBC) | inherent OM | texture | ||
| Mean weight diameter (MWD) | inherent OM | texture | season | |
| Soil reaction (pH) | crop | |||
| Potentially mineralizable N (PMN) | inherent OM | texture | climate | |
| Metabolic quotient (qCO2) | texture | |||
| Sodium adsorption ratio (SAR) | EC | |||
| Soil P (low) | crop | TOC or OM | texture | method |
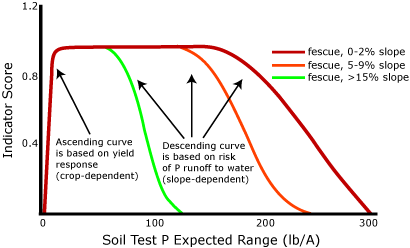
| Soil P (high) | slope | TOC or OM | texture | method |
| Total organic C (TOC) | inherent OM | texture | climate | |
The figure below shows how the scoring for soil test P changes with slope. It assumes that all other factors are held constant.
Norgaard, R.B. 1994 Development Betrayed: the End of Progress and a Coevolutionary Revisioning of the Future. Routledge.
Yakowitz, D. S., J. J. Stone, L. J. Lane, P. Heilman, J. Masterson, J. Abolt, and B. Imam. 1993. A decision support system for evaluating the effects of alternative farm management systems on water quality and economics. Water Science Technology 28 (3-5): 47-54.
Wymore, W. 1993. Model-Based Systems Engineering, CRC Press, Boca Raton.
Karlen, D.L. and D.E. Stott. 1994. A framework for evaluating physical and chemical indicators of soil quality. In J. W. Doran, D. C. Coleman, D. F. Bezdicek and B. A. Stewart, eds. Defining Soil Quality for a Sustainable Environment. SSSA, Inc., Madison, Wisconsin, USA.
Updated: September 19, 2011
This site is a collaboration between the
NRCS East National Technology Support Center, NRCS National Soil Survey Center, ARS National Laboratory for Agriculture and the Environment,
NCERA-59 Scientists,
and Department of Natural Resources and Environmental Sciences, University of Illinois at Urbana-Champaign.
This site designed by the NRCS East National Technology Support Center.